Infos :
Pictures :
Site Links :
Help of Travel :
|
|
Namibia : Climate and geography
Prepare your travel to Namibia
I. When to go to namibia ?
From October to December:
Hot dry season of short rains are saying. The rains are increasing with the days.
From December to April:
Rainy season and was very hot in southern interior (cool nights) and more pleasant temperatures on the coast.
The hydrometer is higher in the north. Many tracks impassable in the north, particularly in the Kaokoland.
From May to September:
This is the period of winter and the dry season.
More pleasant temperatures and even colder nights always cool (-10 ° C in the desert).
Sea also fallen this year in the southern part of the country and frequent fogs on the coast.
From May to October is the best time to visit, to enjoy the national parks.
II. Geographical location of Namibia.
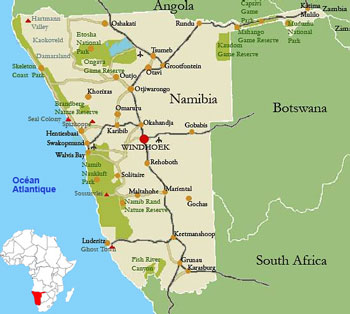
Location of Namibia
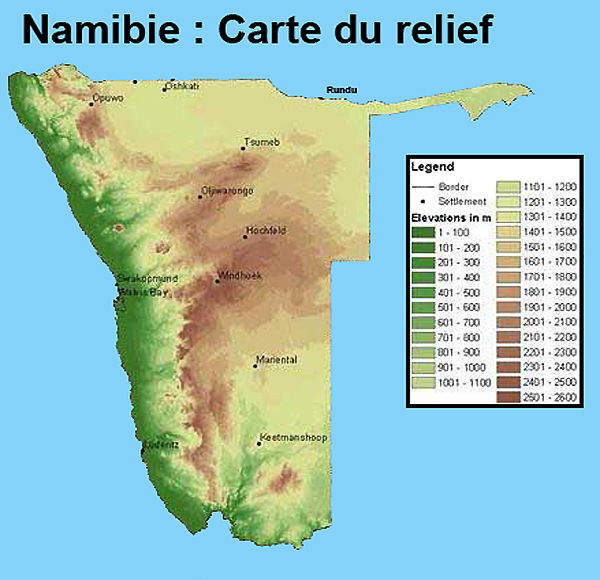
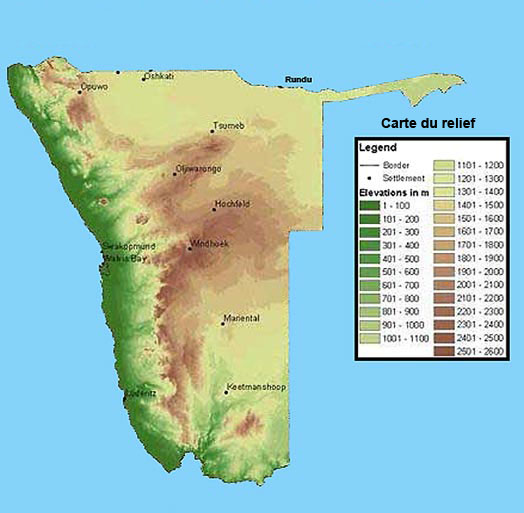
Topographic map (relief) Namibia
|
The area of Namibia is one and half times that of France (824,790 sq km).
It is situated south-west Africa, southern Africa.
Namibia is crossed exactly in the center by the Tropic of Capricorn.
To the west it to 1572 km of coastline with the South Atlantic Ocean.
It is bordered to the south by the South Africa 855 km.
To the west by the Botswana (1360 km).
In the northwest, with Angola (1376 km), its longest border.
North-east, with Zambia (233 km), the shorter its border.
In what is called the Caprivi Strip, the tip of the north-east of the country echoed the tip of the extreme northwest of Zimbabwe .
The tip of Caprivi is a strip of land 105 km wide protruding 480 km northeast of the country.
The structure of Namibia consists of three major geographical:
- The Namib desert, coastal area bathed by the cold Benguela current, covers a fifth of the territory.
- The central plateau, whose altitude is between 1000 and 2000 meters, occupies half of the country.
- The eastern part merges with the western belt of the Kalahari Desert.
|
III. Climatic situation in Namibia.
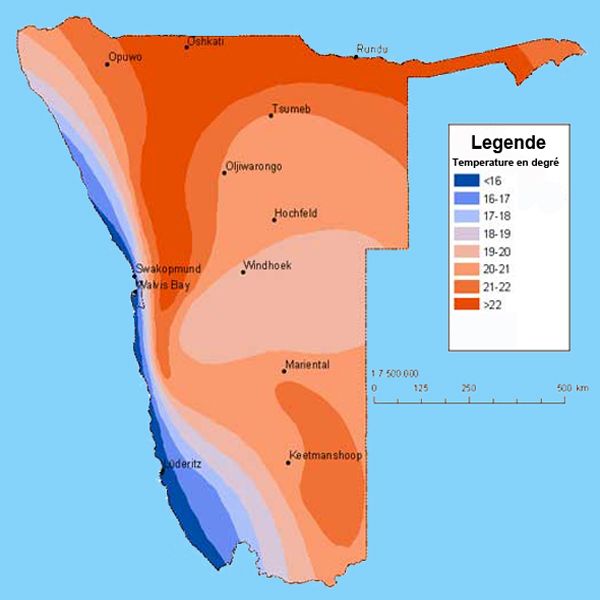
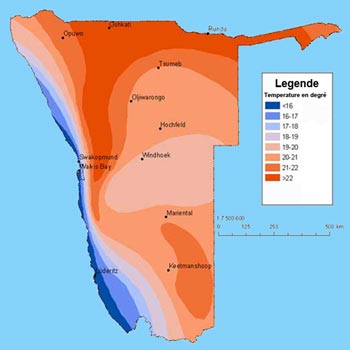
Map of temperature
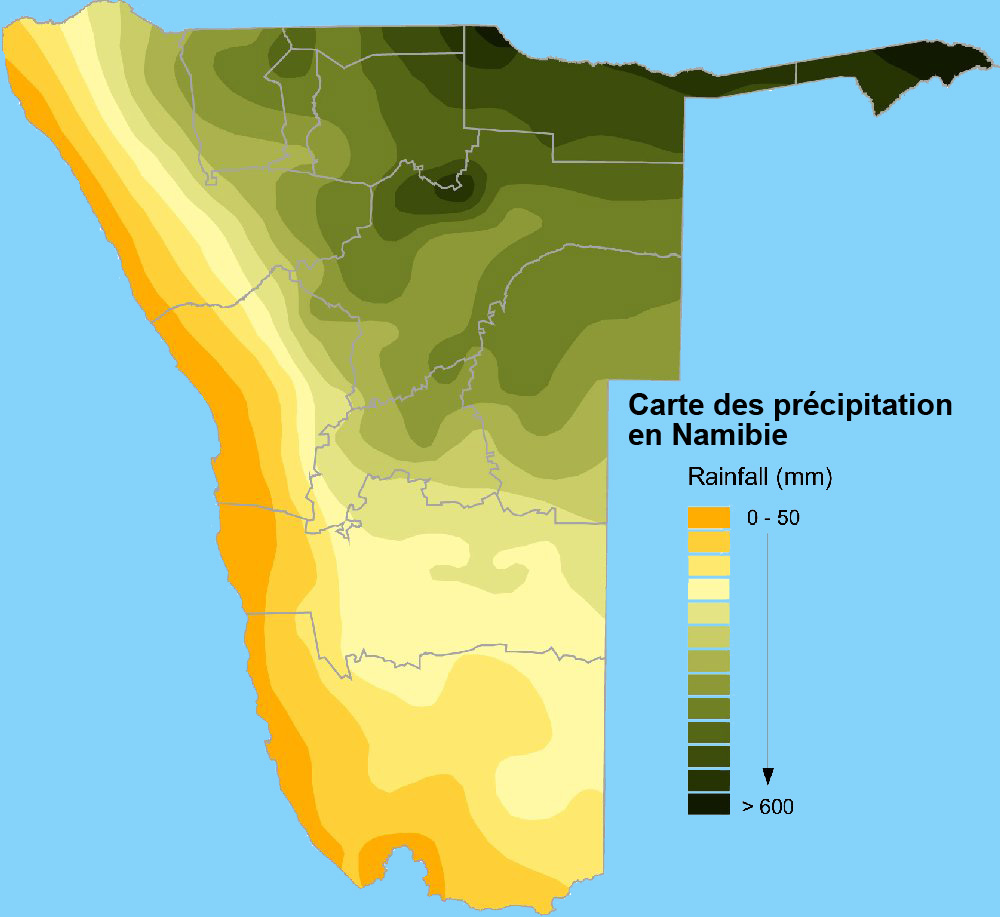
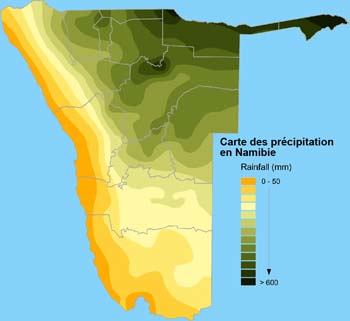
Map of rainfall
|
Namibia season:
In summer (October to April), temperatures in the interior range from 20 ° C and 34 ° C during the day.
Temperatures above 40 ° C are frequently recorded in extreme north and south.
The coast, under the influence of the cold Benguela current, enjoys temperatures between 15 ° C and 25 ° C.
Strong mists are also quite frequent at night.
Humidity is generally very low throughout Namibia, but can reach 80% in the summer in the north of Namibia.
The rainy season is between October and April.
Curve annual rainfall varies from less than 50 mm along the coast to 350mm in the interior and 700mm in the Caprivi.
The sporadic rains do not have strong impact on road transport.
By cons, during the rainy season, flash floods are common and can be violent.
Winter (May to September), temperatures in the interior range from -18 ° C to 25 ° C during the day.
But they often reach the level of ground frost and are below freezing at night.
There are significant regional variations in annual rainfall, which ranges from less than 20 mm in the western Namib and coastal areas, over 700 mm in the east end of the Caprivi Strip.
But only 5% of the area receives over 500 mm of rain.
|
Rainfall (mm)
|
Climate Type
|
% Of area
|
|
100
|
Desert
|
22
|
|
101-300
|
Arid
|
33
|
|
301-500
|
Semi-arid
|
37
|
|
501-700
|
Subhumid
|
8
|
|
IV. Vegetation and climate in Namibia.
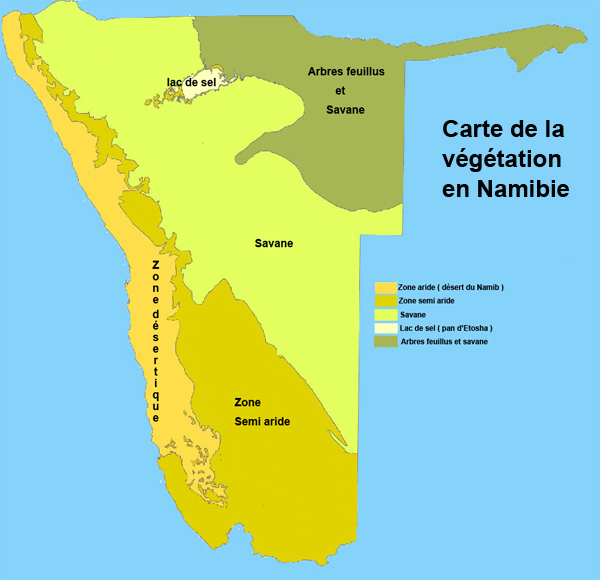
Climate map of Namibia
 climate in Namibia
Arid and semi-arid Namibia:
|
Virtually nonexistent on the coast, shows dense vegetation to the north and tropical arid or semi-desert, in the rest of the country, with thorny.
The highest point is Mount Koenigstein (2636 m) in the massive Brandberg.
The Namibia has three types of climate: desert, semi-desert and subtropical.
Water in namibia
Namibia is a country with natural fresh water resources very limited.
The main rivers are the Orange to the south, Cunene, the Kavango and Zambezi in the north and northeast.
They serve as natural frontiers with neighboring countries.
With the exception of those which mark the northern and southern borders, the rivers are mostly dry.
There are only two natural lakes.
Center north is Etosha, with its center, a dry lake of 5000km2 who sometimes filled in the most violent of the southern summer.
|
The Namib Desert in the west, along the coast and the Kalahari Desert to the east cover two thirds of the country.
They are separated by a central plateau whose altitude is between 1000 and 2000m.
Although there are vast expanses of brown sand, no rivers or permanent lake in the Kalahari desert, it rains often.
There it develops a bushy vegetation, which houses some rare species of the animal world as sable.
North west is arid plains and valleys Kaokoland dominated by rugged mountain ranges, inhabited almost exclusively by the semi-nomadic Himba tribe of.
It is a semi-desert region.
|
V. Temperature and rainfall in major cities in Namibia
|
January |
February |
March |
April |
May |
June |
July |
August |
September |
October |
November |
December |
Temperature max |
30 |
29 |
27 |
26 |
23 |
20 |
21 |
23 |
27 |
29 |
30 |
31 |
Temperature min |
17 |
17 |
16 |
13 |
10 |
7 |
7 |
9 |
12 |
15 |
16 |
17 |
Rainfall (mm) |
75 |
80 |
76 |
36 |
7 |
1 |
1 |
1 |
3 |
11 |
25 |
42 |
|
January |
February |
March |
April |
May |
June |
July |
August |
September |
October |
November |
December |
Temperature max |
31 |
31 |
31 |
31 |
29 |
27 |
26 |
30 |
33 |
35 |
34 |
33 |
Temperature min |
19 |
19 |
18 |
15 |
11 |
7 |
7 |
10 |
15 |
19 |
20 |
20 |
Rainfall (mm) |
152 |
138 |
85 |
29 |
2 |
0 |
0 |
0 |
3 |
21 |
53 |
81 |
|
January |
February |
March |
April |
May |
June |
July |
August |
September |
October |
November |
December |
Temperature max |
20 |
19 |
20 |
19 |
20 |
19 |
18 |
17 |
16 |
17 |
18 |
20 |
Temperature min |
15 |
14 |
15 |
13 |
12 |
11 |
11 |
10 |
10 |
12 |
12 |
14 |
Rainfall (mm) |
1 |
1 |
4 |
0 |
1 |
1 |
0 |
0 |
0 |
0 |
0 |
0 |
|
January |
February |
March |
April |
May |
June |
July |
August |
September |
October |
November |
December |
Temperature max |
31 |
31 |
30 |
29 |
27 |
25 |
25 |
29 |
34 |
33 |
30 |
30 |
Temperature min |
19 |
19 |
19 |
15 |
10 |
6 |
5 |
8 |
14 |
18 |
19 |
19 |
Rainfall (mm) |
169 |
161 |
89 |
18 |
2 |
1 |
0 |
0 |
3 |
19 |
70 |
152 |
|
January |
February |
March |
April |
May |
June |
July |
August |
September |
October |
November |
December |
Temperature max |
32 |
31 |
31 |
31 |
29 |
27 |
27 |
30 |
33 |
35 |
33 |
33 |
Temperature min |
19 |
19 |
19 |
17 |
12 |
9 |
8 |
10 |
13 |
17 |
19 |
19 |
Rainfall (mm) |
109 |
118 |
92 |
34 |
3 |
1 |
0 |
0 |
2 |
13 |
47 |
72 |
|
January |
February |
March |
April |
May |
June |
July |
August |
September |
October |
November |
December |
Temperature max |
31 |
30 |
29 |
29 |
27 |
24 |
24 |
27 |
31 |
32 |
32 |
31 |
Temperature min |
19 |
18 |
17 |
14 |
10 |
7 |
7 |
10 |
14 |
17 |
18 |
18 |
Rainfall (mm) |
142 |
127 |
100 |
30 |
4 |
0 |
0 |
1 |
5 |
22 |
52 |
71 |
|
January |
February |
March |
April |
May |
June |
July |
August |
September |
October |
November |
December |
Temperature max |
31 |
31 |
30 |
28 |
26 |
22 |
22 |
25 |
39 |
31 |
32 |
32 |
Temperature min |
19 |
18 |
16 |
12 |
8 |
4 |
3 |
6 |
10 |
14 |
16 |
18 |
Rainfall (mm) |
81 |
87 |
54 |
37 |
6 |
3 |
0 |
1 |
8 |
16 |
37 |
41 |
|
January |
February |
March |
April |
May |
June |
July |
August |
September |
October |
November |
December |
Temperature max |
35 |
34 |
32 |
29 |
25 |
22 |
21 |
24 |
27 |
30 |
32 |
35 |
Temperature min |
19 |
19 |
18 |
14 |
10 |
7 |
6 |
8 |
11 |
14 |
16 |
18 |
Rainfall (mm) |
24 |
42 |
36 |
15 |
5 |
2 |
1 |
1 |
3 |
6 |
11 |
13 |
Okaukuejo |
January |
February |
March |
April |
May |
June |
July |
August |
September |
October |
November |
December |
Temperature max |
35 |
33 |
32 |
29 |
28 |
26 |
26 |
28 |
33 |
34 |
36 |
35 |
Temperature min |
17 |
20 |
17 |
16 |
11 |
7 |
7 |
10 |
12 |
18 |
17 |
18 |
Rainfall (mm) |
105 |
70 |
36 |
35 |
1 |
0 |
0 |
0 |
0 |
10 |
19 |
38 |
|
January |
February |
March |
April |
May |
June |
July |
August |
September |
October |
November |
December |
Temperature max |
20 |
20 |
22 |
19 |
19 |
18 |
17 |
16 |
16 |
16 |
18 |
19 |
Temperature min |
15 |
15 |
14 |
12 |
12 |
12 |
11 |
11 |
11 |
12 |
13 |
14 |
Rainfall (mm) |
0 |
1 |
1 |
0 |
1 |
0 |
1 |
1 |
0 |
0 |
1 |
0 |
|
January |
February |
March |
April |
May |
June |
July |
August |
September |
October |
November |
December |
Temperature max |
30 |
29 |
27 |
26 |
23 |
20 |
21 |
23 |
37 |
29 |
30 |
31 |
Temperature min |
17 |
17 |
15 |
13 |
9 |
7 |
6 |
9 |
12 |
15 |
16 |
17 |
Rainfall (mm) |
8 |
9 |
8 |
4 |
1 |
0 |
0 |
0 |
0 |
2 |
4 |
5 |
|
January |
February |
March |
April |
May |
June |
July |
August |
September |
October |
November |
December |
Temperature max |
18 |
19 |
19 |
18 |
19 |
18 |
17 |
16 |
16 |
15 |
17 |
17 |
Tempperature min |
15 |
16 |
16 |
14 |
13 |
13 |
11 |
11 |
11 |
12 |
12 |
14 |
Rainfall (mm) |
2 |
2 |
6 |
1 |
0 |
1 |
0 |
0 |
0 |
0 |
1 |
0 |
|
January |
February |
March |
April |
May |
June |
July |
August |
September |
October |
November |
December |
Temperature moy |
19 |
19 |
17,5 |
14,8 |
11,2 |
8,9 |
8 |
9,7 |
11,6 |
14,4 |
16,5 |
18,3 |
Rainfall (mm) |
12 |
15 |
19 |
10 |
15 |
14 |
21 |
11 |
11 |
3 |
1 |
3 |
|
January |
February |
March |
April |
May |
June |
July |
August |
September |
October |
November |
December |
Temperature moy |
24,7 |
24,4 |
22,7 |
19,4 |
14,5 |
11,7 |
10,9 |
12,8 |
15,6 |
19,2 |
21,8 |
24,4 |
Rainfall (mm) |
20 |
35 |
32 |
17 |
7 |
5 |
5 |
2 |
7 |
6 |
7 |
10 |
|
January |
February |
March |
April |
May |
June |
July |
August |
September |
October |
November |
December |
Rainfall (mm) |
45 |
54 |
46 |
16 |
1 |
0 |
0 |
0 |
1 |
4 |
5 |
14 |
|
January |
February |
March |
April |
May |
June |
July |
August |
September |
October |
November |
December |
Rainfall (mm) |
27 |
35 |
44 |
10 |
3 |
0 |
0 |
0 |
1 |
3 |
10 |
3 |
|
January |
February |
March |
April |
May |
June |
July |
August |
September |
October |
November |
December |
Temperature moy |
24,5 |
24,2 |
22,5 |
19,8 |
15,9 |
13,2 |
12,6 |
14,9 |
17,4 |
20,5 |
22,4 |
24 |
Rainfall (mm) |
41 |
60 |
43 |
17 |
7 |
6 |
2 |
3 |
4 |
9 |
13 |
13 |
|
January |
February |
March |
April |
May |
June |
July |
August |
September |
October |
November |
December |
Rainfall (mm) |
88 |
94 |
63 |
23 |
6 |
3 |
0 |
2 |
3 |
9 |
25 |
29 |
|
January |
February |
March |
April |
May |
June |
July |
August |
September |
October |
November |
December |
Rainfall (mm) |
69 |
81 |
66 |
23 |
8 |
17 |
2 |
18 |
5 |
6 |
15 |
17 |
|
January |
February |
March |
April |
May |
June |
July |
August |
September |
October |
November |
December |
Rainfall (mm) |
109 |
94 |
59 |
17 |
0 |
0 |
0 |
0 |
3 |
16 |
27 |
45 |
|
January |
February |
March |
April |
May |
June |
July |
August |
September |
October |
November |
December |
Temperature moy |
23,8 |
23,2 |
22,4 |
21,2 |
18,1 |
15,4 |
15,1 |
17,6 |
21,1 |
23 |
23,8 |
23,8 |
Rainfall (mm) |
76 |
89 |
69 |
20 |
0 |
0 |
0 |
0 |
2 |
17 |
25 |
31 |
|
January |
February |
March |
April |
May |
June |
July |
August |
September |
October |
November |
December |
Rainfall (mm) |
88 |
92 |
115 |
28 |
1 |
0 |
0 |
1 |
0 |
12 |
40 |
58 |
|
January |
February |
March |
April |
May |
June |
July |
August |
September |
October |
November |
December |
Temperature moy |
24,9 |
24,2 |
23,3 |
21,9 |
18,7 |
16,3 |
16,3 |
19,1 |
23,5 |
24,4 |
25,5 |
25,3 |
Rainfall (mm) |
130 |
113 |
89 |
31 |
2 |
1 |
0 |
0 |
2 |
17 |
59 |
60 |
|
January |
February |
March |
April |
May |
June |
July |
August |
September |
October |
November |
December |
Rainfall (mm) |
22 |
29 |
29 |
11 |
0 |
0 |
0 |
0 |
0 |
1 |
4 |
5 |
|
January |
February |
March |
April |
May |
June |
July |
August |
September |
October |
November |
December |
Temperature max |
18 |
19 |
19 |
18 |
19 |
18 |
17 |
16 |
16 |
15 |
17 |
17 |
Temperature min |
15 |
16 |
16 |
14 |
13 |
13 |
11 |
11 |
11 |
12 |
12 |
14 |
Rainfall (by day) |
1 |
0 |
2 |
1 |
0 |
1 |
0 |
1 |
1 |
0 |
0 |
0 |
|
January |
February |
March |
April |
May |
June |
July |
August |
September |
October |
November |
December |
Temperature max |
30 |
29 |
27 |
26 |
23 |
20 |
21 |
23 |
27 |
29 |
30 |
31 |
Temperature min |
17 |
17 |
15 |
13 |
9 |
7 |
6 |
9 |
12 |
15 |
16 |
17 |
Rainfall (by day) |
8 |
9 |
8 |
4 |
1 |
0 |
0 |
0 |
0 |
2 |
4 |
5 |
|
January |
February |
March |
April |
May |
June |
July |
August |
September |
October |
November |
December |
Temperature max |
30 |
29 |
27 |
26 |
23 |
20 |
21 |
23 |
27 |
29 |
30 |
31 |
Temperature min |
17 |
17 |
15 |
13 |
9 |
7 |
6 |
9 |
12 |
15 |
16 |
17 |
Rainfall (by day) |
8 |
9 |
8 |
4 |
1 |
0 |
0 |
0 |
0 |
2 |
4 |
5 |
|
January |
February |
March |
April |
May |
June |
July |
August |
September |
October |
November |
December |
Rainfall (by day) |
15 |
14 |
12 |
6 |
2 |
0 |
0 |
0 |
2 |
6 |
11 |
15 |
|
January |
February |
March |
April |
May |
June |
July |
August |
September |
October |
November |
December |
Temperature max |
28 |
27 |
27 |
26 |
25 |
22 |
22 |
25 |
29 |
30 |
30 |
30 |
Temperature min |
20 |
19 |
17 |
15 |
10 |
7 |
6 |
10 |
15 |
18 |
19 |
20 |
Rainfall (by day) |
15 |
14 |
12 |
6 |
2 |
0 |
0 |
0 |
2 |
6 |
11 |
15 |
|
January |
February |
March |
April |
May |
June |
July |
August |
September |
October |
November |
December |
Rainfall (by day) |
1 |
0 |
2 |
1 |
0 |
1 |
0 |
1 |
1 |
0 |
0 |
0 |
|
January |
February |
March |
April |
May |
June |
July |
August |
September |
October |
November |
December |
Temperature max |
30 |
29 |
32 |
21 |
29 |
27 |
25 |
23 |
35 |
37 |
30 |
29 |
Temperature min |
13 |
15 |
16 |
14 |
13 |
12 |
9 |
7 |
8 |
10 |
12 |
13 |
Rainfall (mm) |
0 |
21 |
6 |
6 |
0 |
6 |
0 |
0 |
0 |
0 |
0 |
0 |
|
January |
February |
March |
April |
May |
June |
July |
August |
September |
October |
November |
December |
Temperature max |
34 |
32 |
31 |
28 |
25 |
21 |
21 |
24 |
37 |
30 |
32 |
33 |
Temperature min |
19 |
18 |
16 |
12 |
8 |
3 |
3 |
4 |
8 |
12 |
15 |
17 |
Rainfall (mm) |
33 |
48 |
45 |
15 |
0 |
0 |
0 |
0 |
0 |
6 |
9 |
21 |
|
January |
February |
March |
April |
May |
June |
July |
August |
September |
October |
November |
December |
Temperature max |
- |
- |
- |
- |
- |
- |
|
- |
- |
- |
- |
- |
Temperature min |
- |
- |
- |
- |
- |
- |
|
- |
- |
- |
- |
- |
Rainfall (mm) |
- |
- |
- |
- |
- |
- |
|
- |
- |
- |
- |
- |
|
January |
February |
March |
April |
May |
June |
July |
August |
September |
October |
November |
December |
Temperature max |
28 |
27 |
27 |
26 |
25 |
22 |
22 |
25 |
29 |
30 |
30 |
30 |
Temperature min |
20 |
19 |
17 |
15 |
10 |
7 |
6 |
10 |
15 |
18 |
19 |
20 |
Rainfall (mm) |
15 |
14 |
12 |
6 |
2 |
0 |
0 |
0 |
2 |
6 |
11 |
15 |
|
January |
February |
March |
April |
May |
June |
July |
August |
September |
October |
November |
December |
Temperature max |
24 |
26 |
22 |
23 |
22 |
15 |
15 |
21 |
17 |
26 |
28 |
21 |
Temperature min |
17 |
16 |
13 |
10 |
8 |
4 |
2 |
5 |
9 |
20 |
18 |
18 |
Rainfall (mm) |
42 |
117 |
63 |
42 |
1 |
12 |
0 |
0 |
0 |
9 |
12 |
48 |
|
January |
February |
March |
April |
May |
June |
July |
August |
September |
October |
November |
December |
Temperature max |
20 |
22 |
21 |
20 |
19 |
16 |
17 |
17 |
18 |
23 |
21 |
19 |
Temperature min |
16 |
17 |
16 |
14 |
10 |
7 |
7 |
8 |
11 |
15 |
16 |
17 |
Rainfall (mm) |
84 |
81 |
57 |
12 |
0 |
0 |
0 |
0 |
0 |
3 |
24 |
63 |
|
January |
February |
March |
April |
May |
June |
July |
August |
September |
October |
November |
December |
Temperature max |
- |
- |
- |
- |
- |
- |
- |
- |
- |
- |
- |
- |
Temperature min |
- |
- |
- |
- |
- |
- |
- |
- |
- |
- |
- |
- |
Rainfall (mm) |
- |
- |
- |
- |
- |
- |
- |
- |
- |
- |
- |
- |
|
January |
February |
March |
April |
May |
June |
July |
August |
September |
October |
November |
December |
Temperature max |
- |
- |
- |
- |
- |
- |
- |
- |
- |
- |
- |
- |
Temperature min |
- |
- |
- |
- |
- |
- |
- |
- |
- |
- |
- |
- |
Rainfall (mm) |
104 |
111 |
42 |
2 |
0 |
0 |
0 |
0 |
1 |
15 |
18 |
49 |
IV. Administrative Map of Namibia
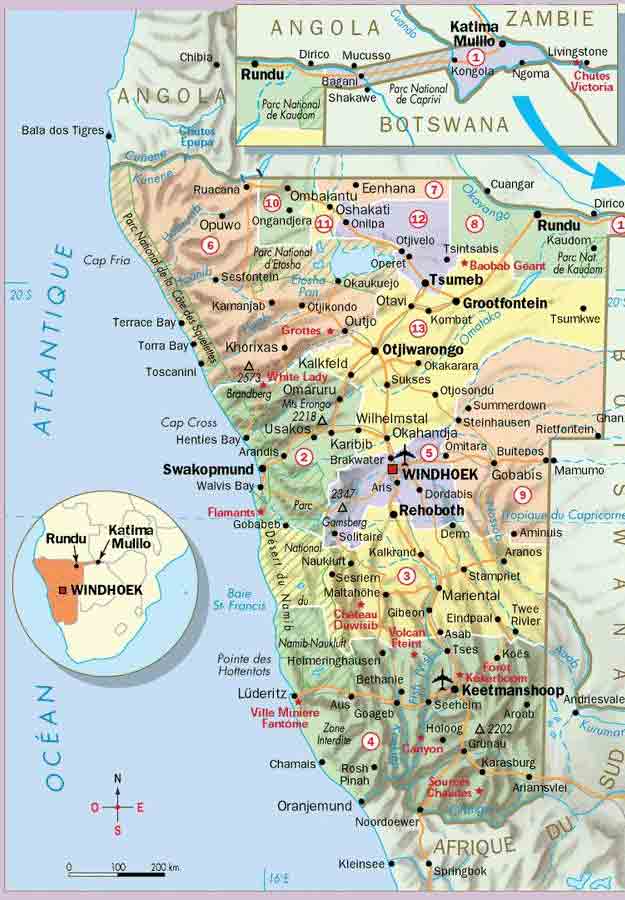
1 = Caprivi Strip | 2 = Erongo | 3 = Hardap | 4 = Karas | 5 = Khomas | 6 = Kunene | 7 = Ohangwena | 8 = kavango |
9 = Omaheke |
10 = Omusati | 11 = Oshana | 12 = Oshikoto | 13 = Otjozondjura
For more information, clicked on the Region of your choice
Source : 2011
|
|
|
|
|
|
|
|